Fundamentally, understanding how galaxies are born, live, and die comes down to understanding the stars sitting inside the galaxy (well, and the dark matter, but that is “beyond the scope of this blog”). That is why for the first half of the blog of this paper, the focus is on how and what we can learn about the stars in a galaxy when we can’t individually resolve stars. Luckily for us, we are sitting directly inside a very good laboratory of the nature of star formation (the Milky Way!) So if we can’t literally count the young stars, how do we calculate a star formation rate?
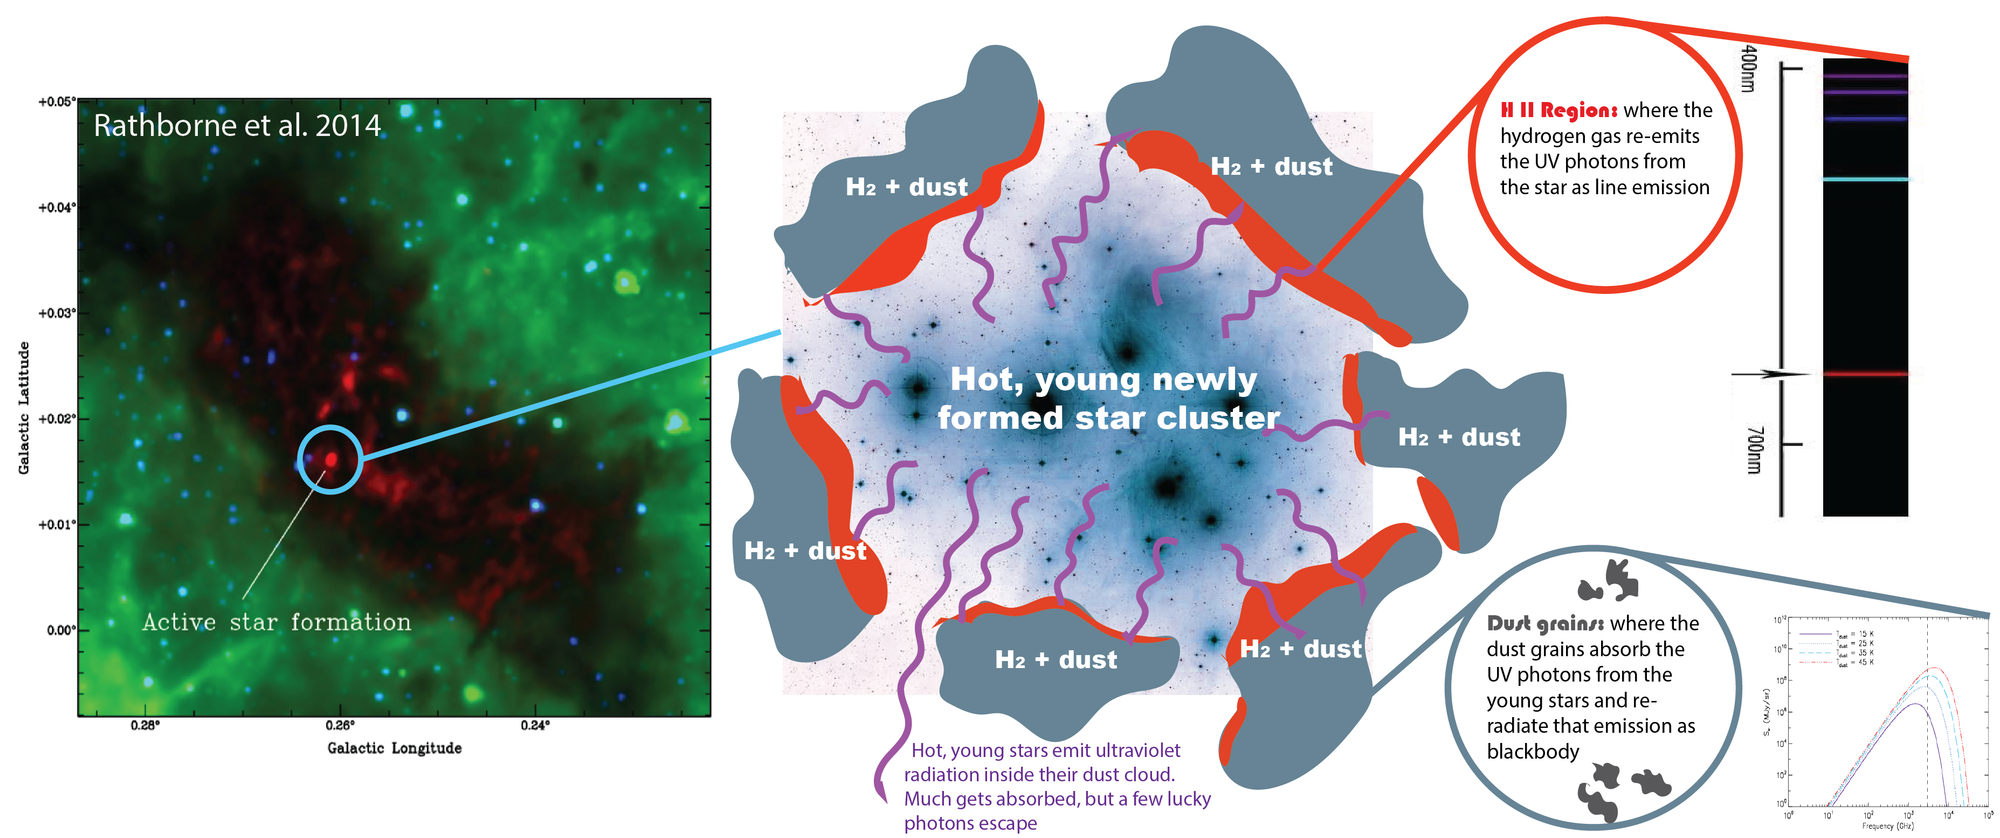
The figure above is a schematic of a star forming region (note: the Brick and the Pleiades are not actually associated). The stars form out of molecular clouds, because it is a region that is both dense and cold. In the region, the youngest and the brightest stars dominate the light. Those stars emit very strongly in the ultraviolet. If we could see all the UV photons in a star-forming region, we could get a good idea of the number of stars that are forming. Alas, because these stars are still in the dense, clumpy “stellar nurseries”, most of those UV photons never make it out. One way that scientists deal with this is make arguments about the geometry of the nursery clouds and count the “escaped” UV photons. At the same time, those UV photons are getting absorbed by the surrounding gas, then re-emitted by the gas that sits at the edge of the star-forming region. Because most of that gas is hydrogen, the emission comes out as hydrogen line emission. This threshold is also where the term H II region comes from. Finally, because these stellar nurseries sit inside of dense clouds, there is also a lot of dust. Unlike the H II region, which emits specific wavelengths of light, the dust doesn’t discriminate the photons it absorbs, and it will re-emit the star-forming light as a blackbody, peaked at the temperature of the dust (up to ~100 Kelvin in the absolute highest star forming objects, like Arp 220). This is why most astronomers use some tracer of the dust emission (like the infrared blackbody emission), the UV emission (directly tracing the young stars, though probably buried under a lot of absorbing material), and the hydrogen lines to infer star formations. Because the dominant energy mechanism in most star-forming galaxies are the young stars, in normal circumstances, these tracers do a pretty good job.
Getting the molecular gas mass requires some similar assumptions. H2 (molecular hydrogen) is the most abundant gas in the star forming nurseries, but is very hard to detect. The reason for this is that H2 lacks a detectable dipole moment, since the molecule is symmetric. It makes direct measurement of H2 in cold clouds really really difficult. Luckily for us, carbon monoxide (CO) has a substantial dipole moment, so when it rotates, it radiates. And that radiation is bright. Carbon and oxygen are also some of the first metals that are formed when stars “turn on”, so it enriches primordial gas fairly quickly. CO requires nearly the same density conditions as H2, so the two molecules are very often in the same region. It was also found within the Milky Way that the luminosity of CO did a very good job tracing the mass of H2 underlying it in giant molecular clouds (you can read about this more from this beautiful astrobite by Adele Plunkett). So, for the most part, in normal galaxies, CO emission can trace the underlying gas mass, like you can use Hα, UV or dust emission to trace the star formation.
Unless you are NGC 1266.
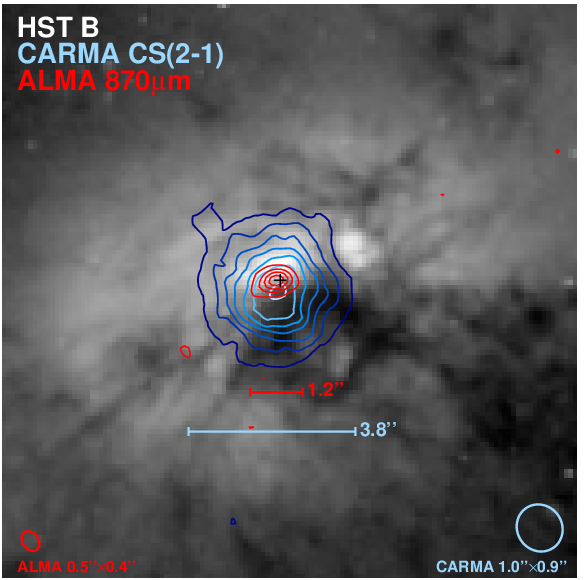
NGC 1266 breaks all of these “reliable rules”. How? Let’s start with the gas (because the star formation is more complicated). The dependence of H2 mass on CO luminosity requires a big assumption: that the gas in your system looks like the gas in the Milky Way. For NGC 1266, it is probable that that is not true. The gas is not distributed in discrete giant molecular clouds (where the entire relation is derived). So, if we can’t use CO, what can we use? Denser gas and gravity. CS (carbon monosulfide) is much less abundant than CO, and require denser conditions to form. This means that you are probably counting the photons that are coming from all the CS molecules, instead of just the ones at the optically thick surface (as is the case with CO). In this paper, we looked at the CS and used that to figure out the H2 mass, assuming a specific abundance of CS to H2, and it gave us a surface density 10^4 M⊙/pc^2, which is close to what we see in mergers, the location of some of the densest molecular gas in the local universe. The other thing we can do is use force balance, measuring the line width in NGC 1266, which traces rotation and dispersion, and calculate how much mass needs to be in the center to balance the forces. This also told us that the surface density was 10^4 M⊙/pc^2. Excellent, we now had a gas mass. We also detected HCN and CS (dense gas tracers) had broad line wings, telling us that this gas was taking part in the outflow. This changed our estimate of the mass outflow rate, from 13 M⊙/yr to 110 M⊙/yr. In a later blog on my Markarian 231 paper which expands upon why the outflow rate is not a depletion rate.
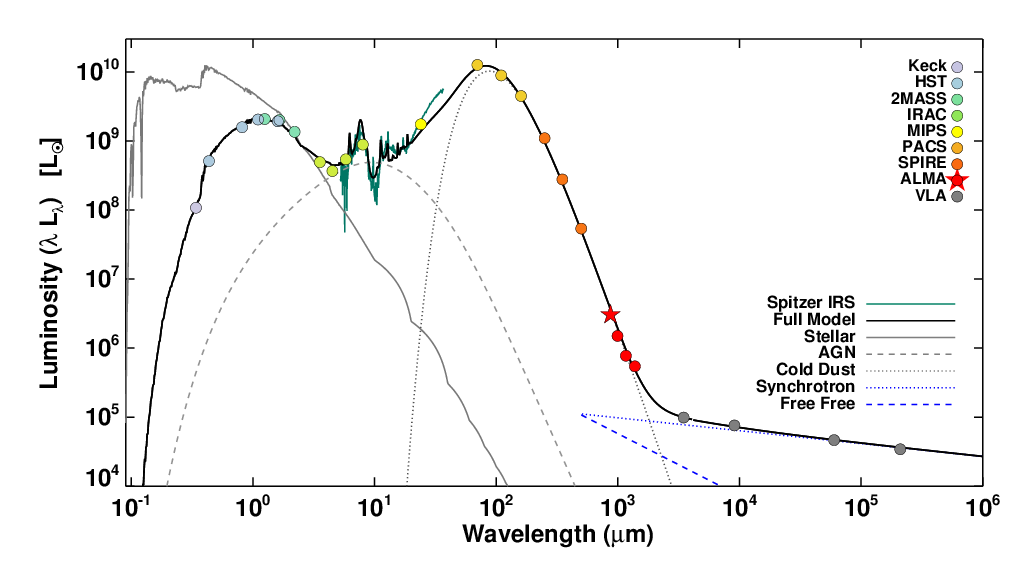
Star formation was more complicated. Many of the simple assumptions that were made on star formation tracers above could not be made for NGC 1266. The Hα emission in NGC 1266 was excited by shocks, the UV emission was partially from older (rather than newborn) stars, and the absorbing column is so high that the UV is impossible to use, and even the dust blackbody could be hiding a bright supermassive black hole. This meant that most of the tracers would give useful limits, but poor estimates. We had to search deeper than the normal star formation tracers, and settled on using a combination of the radio free-free emission (coming from the same H II regions as the Hα, but without the added shock contamination or obscuration) to calculate the star formation rate. This free-free estimate, along with the size of the emitting region were from ALMA observations. Once we had both of these values (star formation rate and gas mass), we looked at how they related to one another.
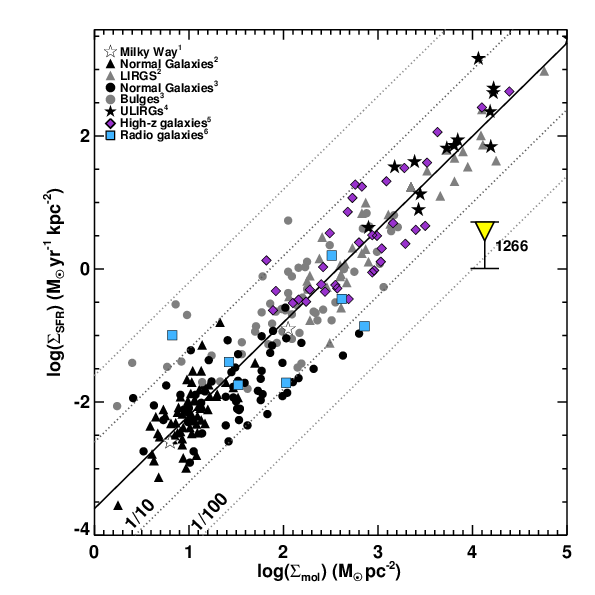
There is a reasonable empirical relationship between the density of star formation and the density of molecular gas, known as the Schmidt-Kennicutt relation. This relation works for star-forming normal galaxies, early-type galaxies, and star bursting galaxies. But it does not work for NGC 1266. In fact, the molecular gas in NGC 1266 is under-forming stars by over a factor of 50. This sort of outlier really had not been seen before NGC 1266, and was the main observing result of this paper.
Through a thorough investigation to pin together the most reliable tracers of the underlying gas mass and star formation, we showed that star formation is taking place with a inefficiency of at least a factor of 50. Given the density of the gas in this region, this suppression is surprising. We crossed our t’s and dotted our i’s in working through our observations, so a factor of 50 is unlikely to come from misassumptions made with regards to the star formation or gas mass measurement.
That leaves us to find a physical explanation for this suppression. The rate at which the gas in a galaxy forms stars is about balance. Stars form at places that gravitational collapse wins against forces such as radiation and turbulence. The fact that 1% star formation efficiency (with scatter) is seen in most objects tells us that this energy balance is about the same in most galaxies. In NGC 1266, the most likely cause of the star formation suppression is that this balance has changed. Something additional is fighting against the gravitational collapse. So we set out to use the observations we had in-hand to find the culprit of the suppression, thus we turned to energy balance. In this case, we can depend on a rich history of theoretical work, but in this case, the Toomre criterion is where we turn for an idea. The Toomre Q parameter describes the balance between gravitational collapse and forces outward, such as rotation and turbulence.
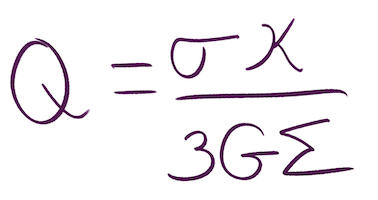
The numerator in the Toomre Q equation deals with energies that balance against gravitation, in this case, the internal dispersion of the gas (σ, a.k.a. the random motions) and the rotation of the disk the gas is in (κ, the epicyclic frequency). Both of these provide extra support against gravity, so the higher either σ or κ is, the more support there will be against gravity. The denominator in the equation deals with gravity, G is the gravitational constant, and Σ is the surface density, that is, the amount of material within an area, the higher Σ is, the more gravity there is to balance out. So, we figured out how much energy we needed in the numerator to balance the denominator. The epicyclic frequency κ was measured in the discovery paper, we got the surface density Σ in this paper, and σ was reported in Pellegrini et al. (2013) based on a fit to the higher CO transitions from Herschel. These told us that Q < 0.4, and thus should have been highly unstable. We then looked directly at the observations of the dense gas, which did not have any obvious ordered motion, and so we wondered if we missed some of the kinetic energy.
So we tried fitting using pure energy balance, and calculated the radial velocity needed instead to balance the mass of the central molecular gas. When we did this, we found that about 100 km/s was needed, which fit our picture! It was very possible that there was enough injected turbulence in this system to explain the suppression of star formation!

The suppression of star formation serves other bigger purposes too. For one, if we look back at when we think the triggering event was, we needed to be able to explain how the molecular gas in the system could have lasted for so long without becoming stars. If the AGN is able to suppress star formation on such long timescales, we have a natural explanation. The gas is being preserved. In fact, it is likely being two-fold preserved.
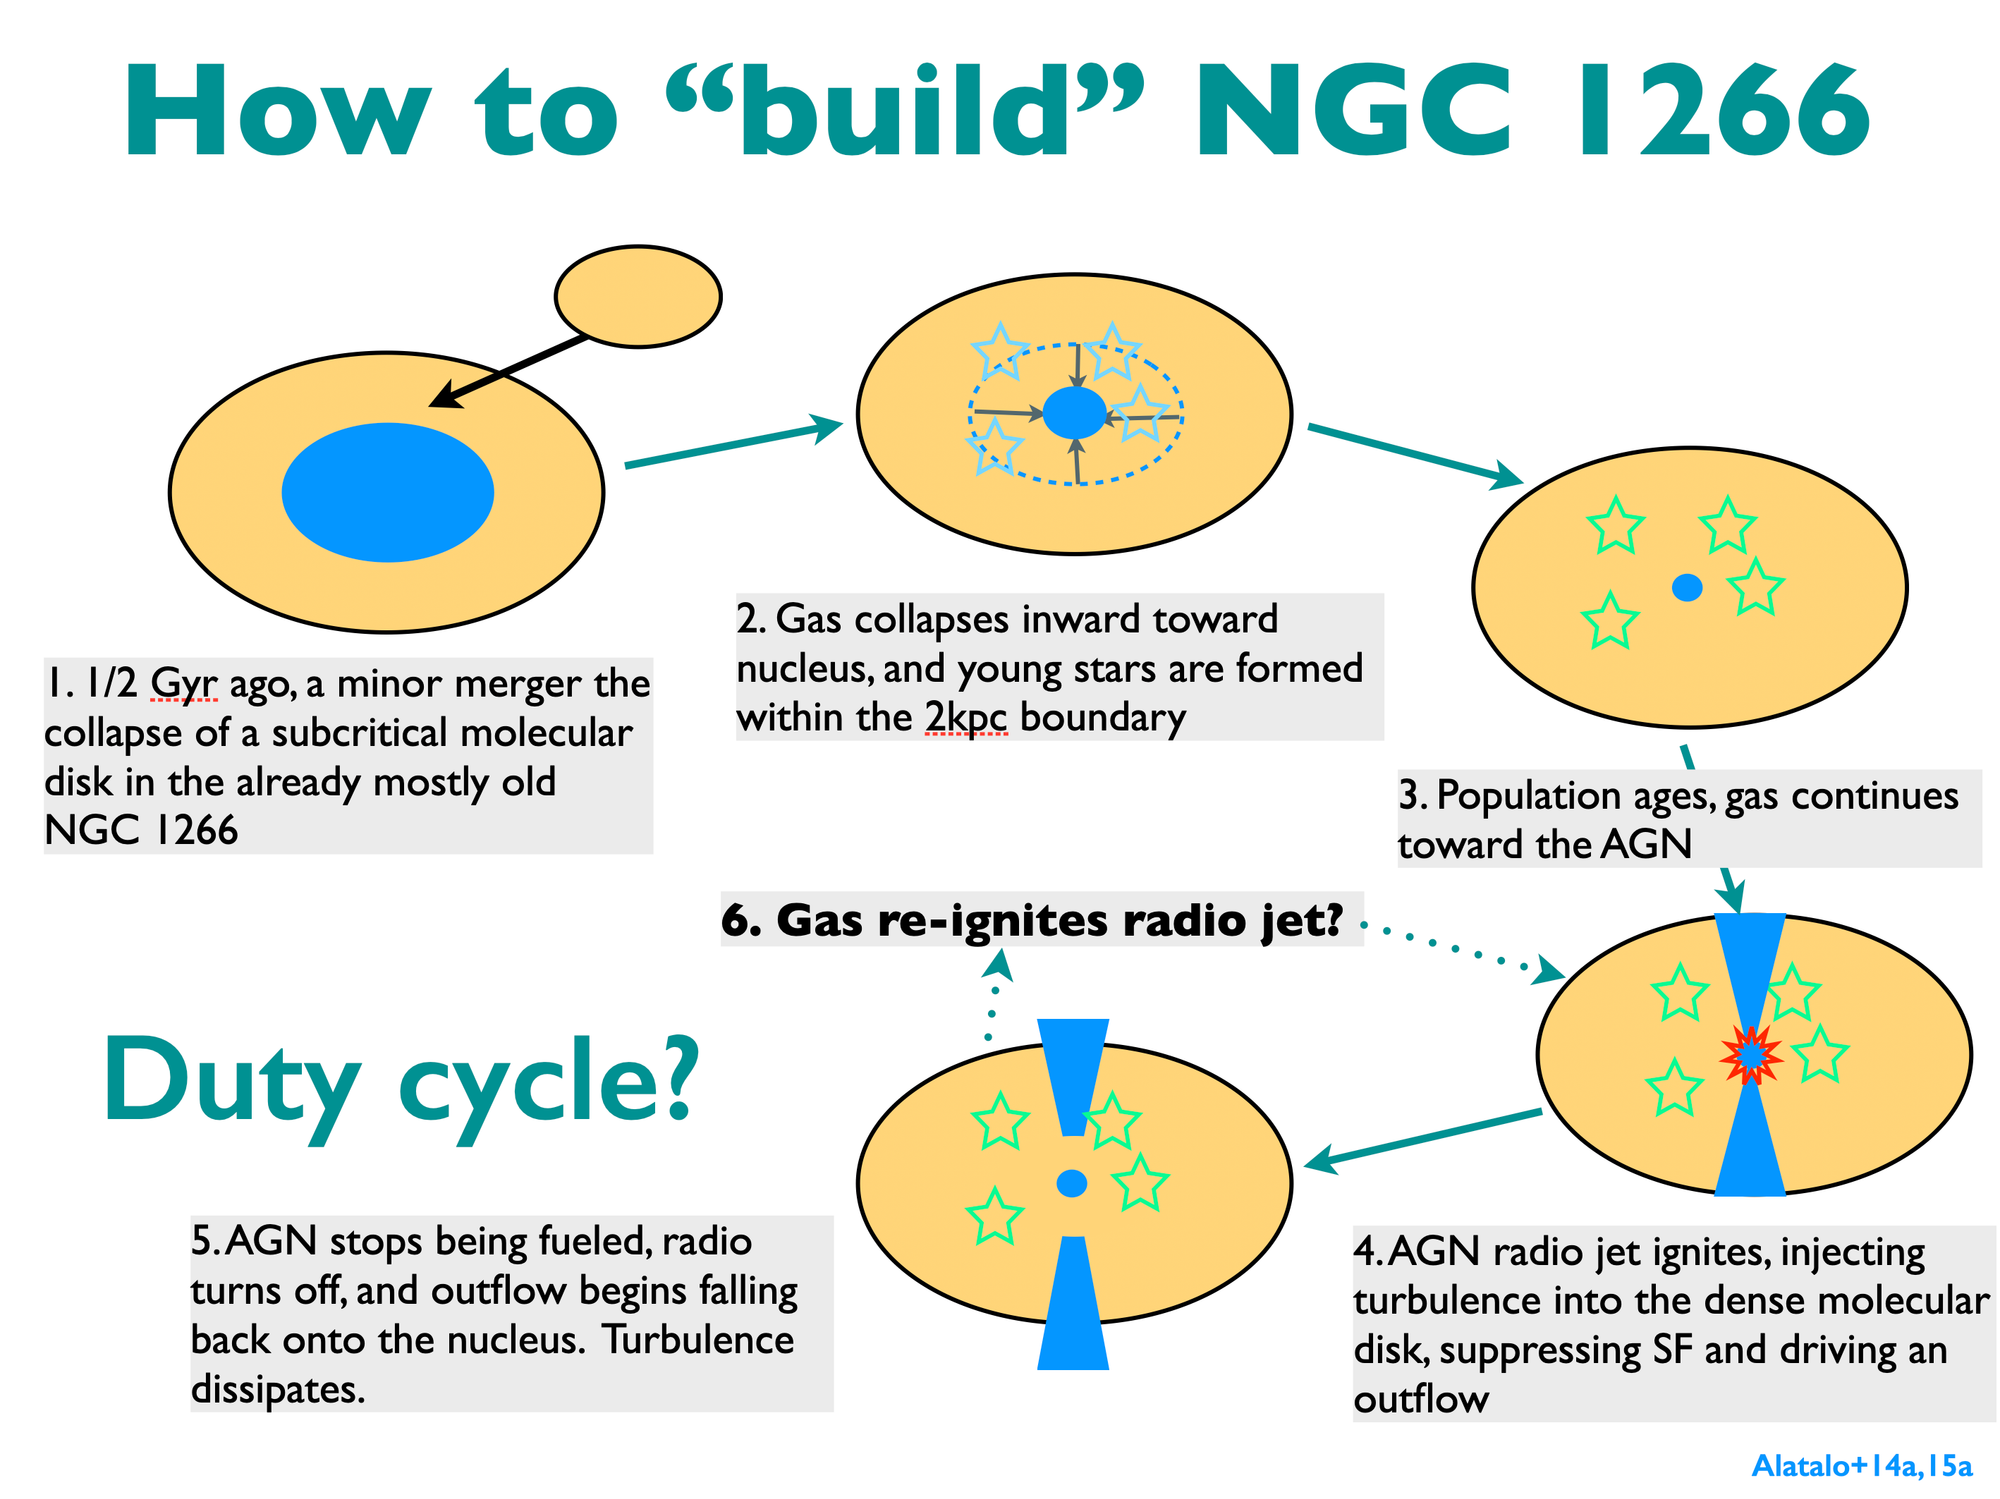
First, the mass outflow rate is not the same as the mass depletion rate. Removing the gas entirely from the system would mean needing to impart enough energy that the gas exceeds the escape velocity. Most of the gas does not meet this criterion, and will instead rain back into the galaxy, depositing its energy back into the disk as turbulence. This allows for a much longer gas survival time. The star formation suppression also acts to extend the lifetime of the gas in the galaxy, so you are able to explain why the gas has remained for so long. So the question is how often does this happen? NGC 1266 was hiding in plain sight for a long time before we truly understood it, and it is beginning to look like molecular outflows are universal in galaxies where molecular gas sits near the supermassive black hole. It is possible that this sort of event is how the M-sigma relation is regulated. But for now, NGC 1266 is a first example that may make up a class of galaxies, which we are just on the cusp of being able to study properly.
The official published version can be found on NASA ADS